Spreadsheet Project
Part 1
|
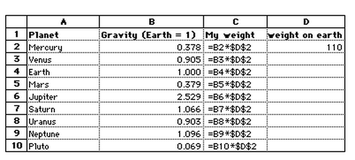
Creating simple formulas:
Creating simple formulas to calculate your weight on another planet teach the learner how to make formulas. They have to input a formula that multiplies the mass cell with the gravity cell. This formula allows them to change individual values and get an adjusted weight value automatically. |
|
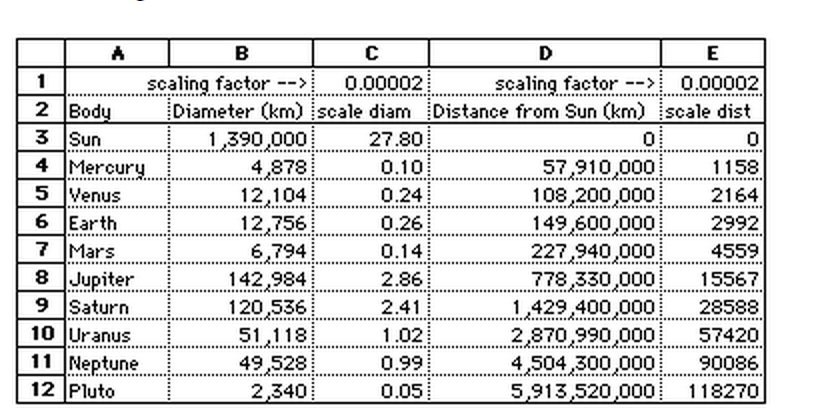
Creating Complex Formulas:
Skills in creating complex formulas allow the user to do much more with spreadsheets. In this example, the user has to create a formula that will scale down the distance of planets form the sun. There is a scaling factor that is applied to the actual distance. This scaling factor gives a scaled distance that can be used to create a model of the solar system. |
|
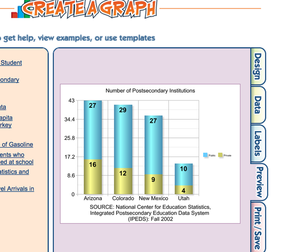
Create a Graph:
The basic skills of creating a graph in a spreadsheet are required for most data. A graph is the visual representation of the data in the spreadsheet. If you are looking at statistics, then the graph will be required to make a histogram of the data. This example is for early elementary, but it incorporates the basic skills required for creating simple graphs. |
|
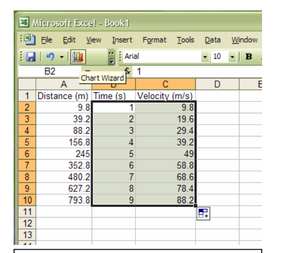
Use Excel as a Physics Calculator:
This is a good example of what you can do with Excel in physics. In this example, it demonstrates how to use Excel as a velocity calculator. You only have to set up a formula once, and you can apply it to a whole data set at one time. This can be very useful to save time when calculating a large amount of data. This example also goes into how to create a graph that represents the data that was calculated. |
Part 2
Students will use a spreadsheet to create a statistical analysis of the heights of students in their class. They will collect the data of their heights and record it in the spreadsheet. They will then use formulas to calculate the Mean, Median, Mode, and Range. With that data they will create a frequency chart that includes the use of Bins. This data will be placed in a chart that is demonstration of a histogram.
Objectives:
Objectives:
- Collect data accurately
- Use a spreadsheet to organize data
- Perform statistical analysis on data
- Represent data in a visual format
|
|
| ||||||
